
Outlook for next week: - In last week update as we mentioned nifty taken nearby 1st support 6135.5 {weekly low is 6139.6}.
Major Trend indicators: - MACD & TRIX below zero line,
ADX @ 15.92 {below 20}, Parabolic SAR @ 6330.36, check the chart

Momentum oscillators: - RSI @ 45.97 {trending zone}, STOC @ 16.73
& WILLIAMS%R @ -85.44 {over sold zone}, Check the chart

Volume Indicators: - MFI @ 41.43, Volume oscillator @ -5.34
NVI @ 190.13 which is above avg 189.87 & PVI @ 361.02 which is below avg 363.9,
check the chart

Volatility Indicators: - ATR @ 68.65 & Nifty heading
towards Bollinger lower band is @ 6106.58 and middle band as of now is @ 6223.15
{nifty cmp 6171.45}, check the chart

Positive & Negative outs puts: - Spot nifty {panic 6216}
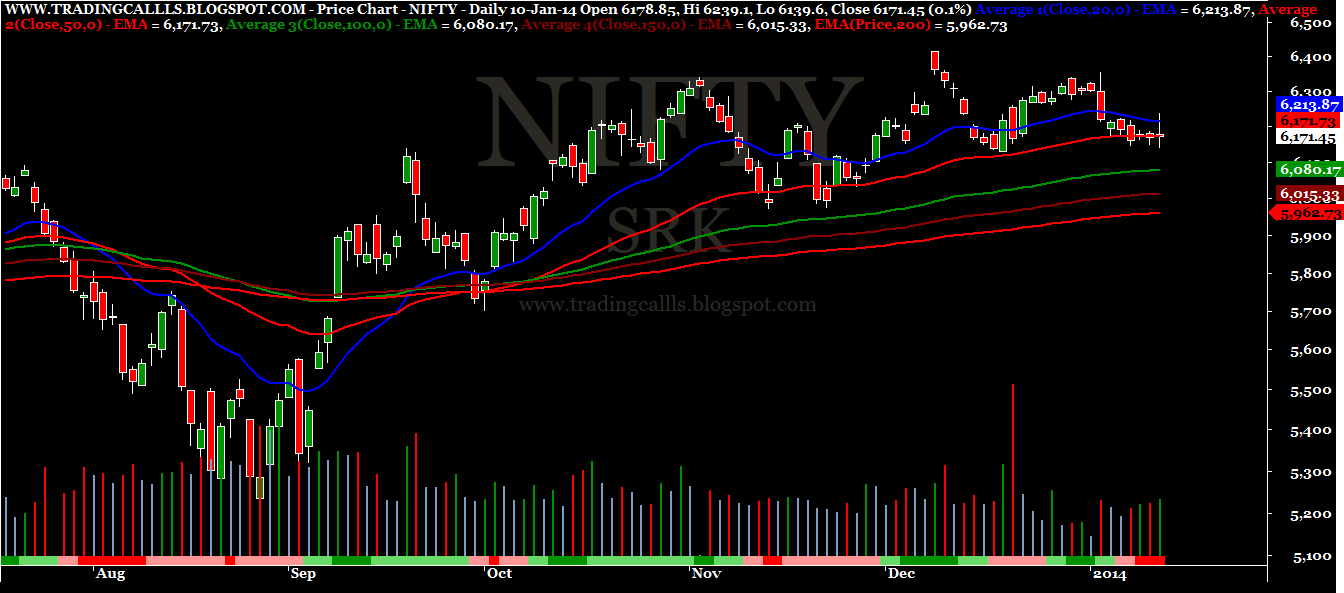
cmp 6171.45 which is above all ema except 20 ema @ 6213.87 & 50 ema @ 6171.73
And 100 ema @ 6080.17 & 200 ema @ 5962.73, Still continues the golden cross
of 20 ema>50ema>100ema>200ema which is a good sign, check the chart
Conclusion: - Spot nifty {cmp 6171.45} below 6183.38 it will
find support @ 6127.67, if it broken on closing basis, next 6083.88-6028.17
Whereas above 6183.38 it will face resistance 6227.17, once
it crossed on closing basis, next 6282.88 - 6326.67
Overall trend turned bearish in daily charts from 2.1.14 as
well as weekly charts from 3.1.14.
thanks,
regards,
Rajesh Saladi
NSE certified Technical Analyst
Your levels are simply great, as you said last week nifty took support at your given level 6136. Looking forward for many more to come . Thanks
ReplyDeleteBy the way last week i had posted comment on your nifty & bank nifty weekly view. Im not able to see the comment, Is it allowed to post comments on your blog? or it is blocked due to some reason?
ReplyDelete